Monitoring errors in production
Track production R errors with glitchtipr: one plumber2 annotation sends failures to GlitchTip with full request context.
When an R error occurs in a production app, it disappears silently, unless you’ve set up error tracking. glitchtipr sends errors to GlitchTip with full context (endpoint, query string, sanitised headers) so you can find and fix them without guessing.
GlitchTip is open source and self-hostable. It implements the Sentry store API, so glitchtipr works with any Sentry-compatible platform.
In the ecosystem
You build your app with htmxr. You ship it. Then what?
Without error tracking, production is a black box. A user hits /plot with
an unexpected parameter. R throws, plumber2 returns a 500, nobody knows.
With glitchtipr, that error lands in your dashboard with everything you
need to reproduce it.
One annotation
glitchtipr ships with a @capture plumber2 tag. Add it above any route.
That’s all it takes.
library(glitchtipr)

gt <- gt_connect()  # reads GLITCHTIP_DSN from .Renviron

#* @capture
#* @get /plot
#* @parser none
#* @serializer none
function(request, query) {
  generate_plot(query$bins %||% 30)
}
@capture wraps the handler automatically. If it throws, the error is reported to
GlitchTip with full context, then re-raised so plumber2 handles it normally.
What you see
Errors are grouped by type and message. Each one shows its occurrence count and when it was last seen, which is useful for spotting regressions after a deploy.
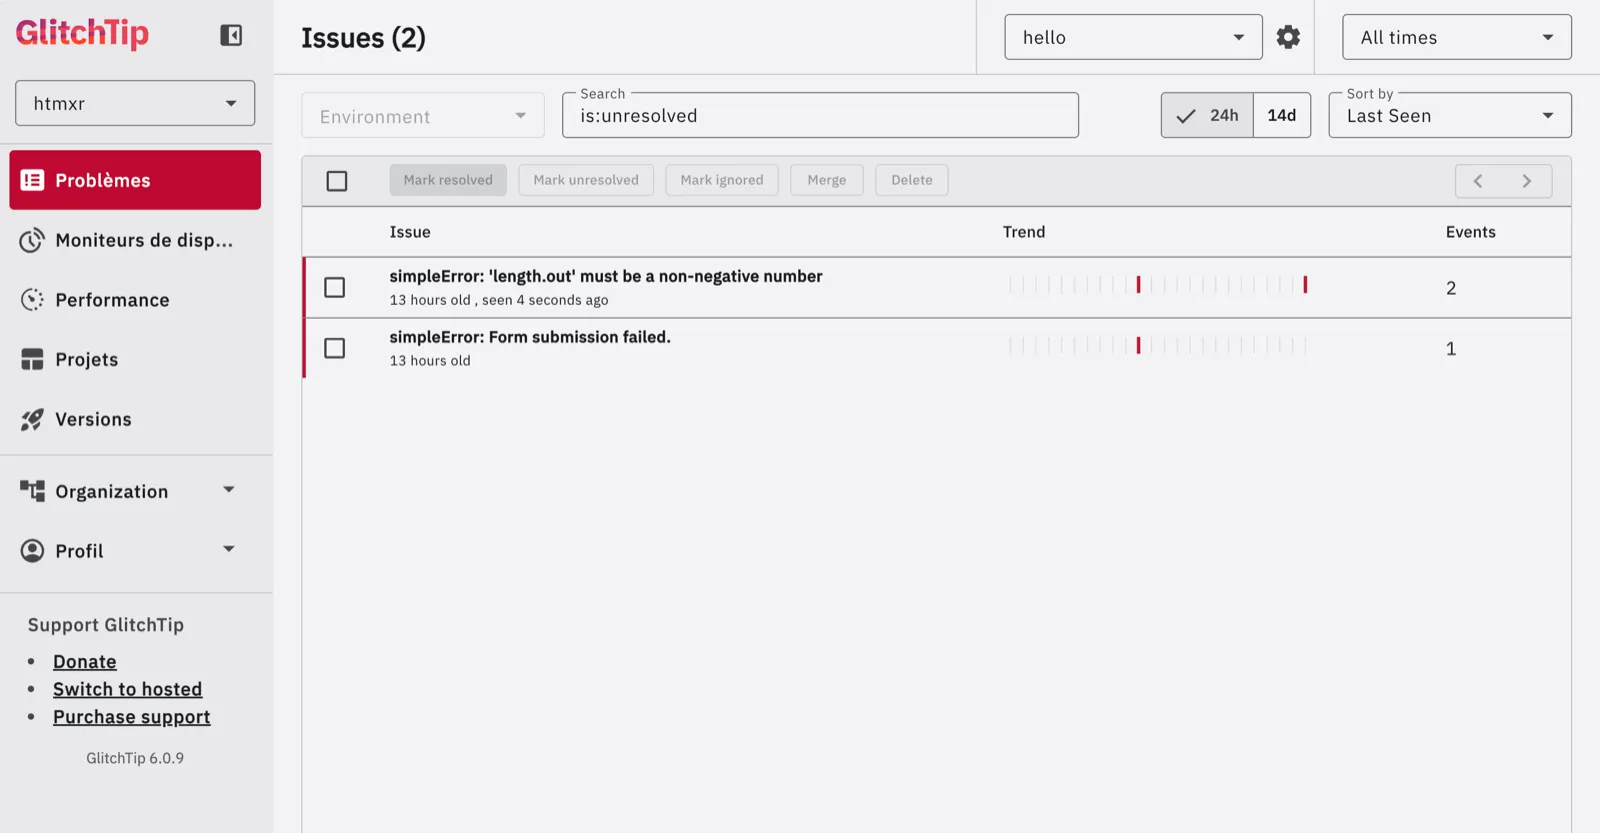
Clicking an issue reveals the full event detail: the endpoint that failed
(GET /plot), the query string that triggered it (bins = a), and the
sanitised request headers.
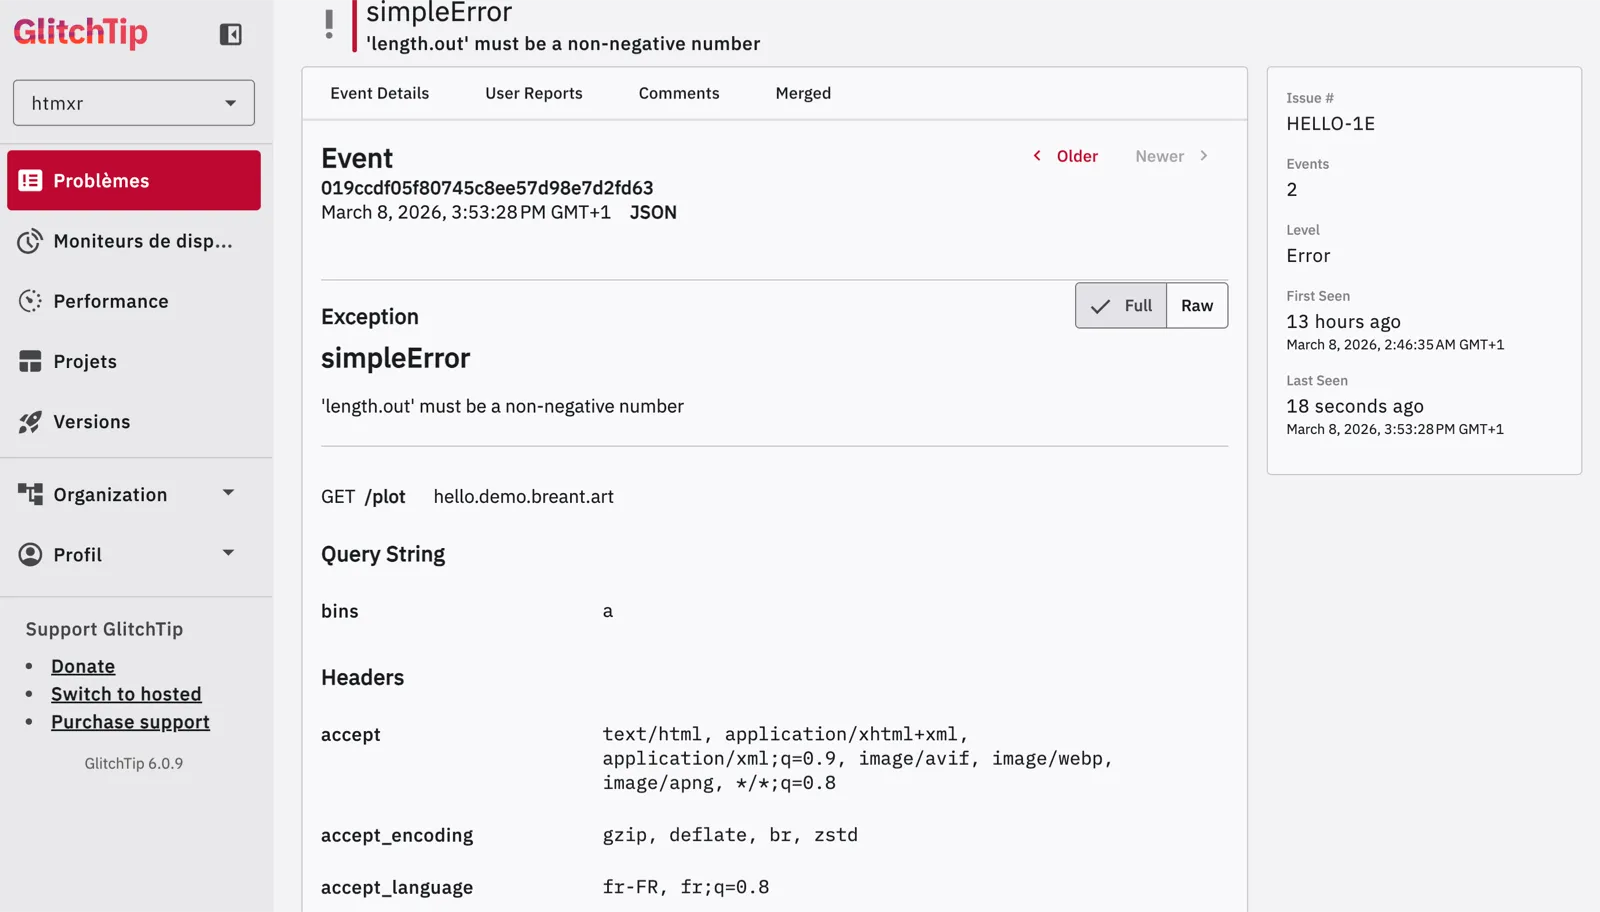
No log digging. No reproducing in the dark. The context is right there.
Uptime monitoring
The same GlitchTip dashboard that tracks your errors tells you whether your app is up. Configure a monitor on your endpoint and get notified when it goes down.
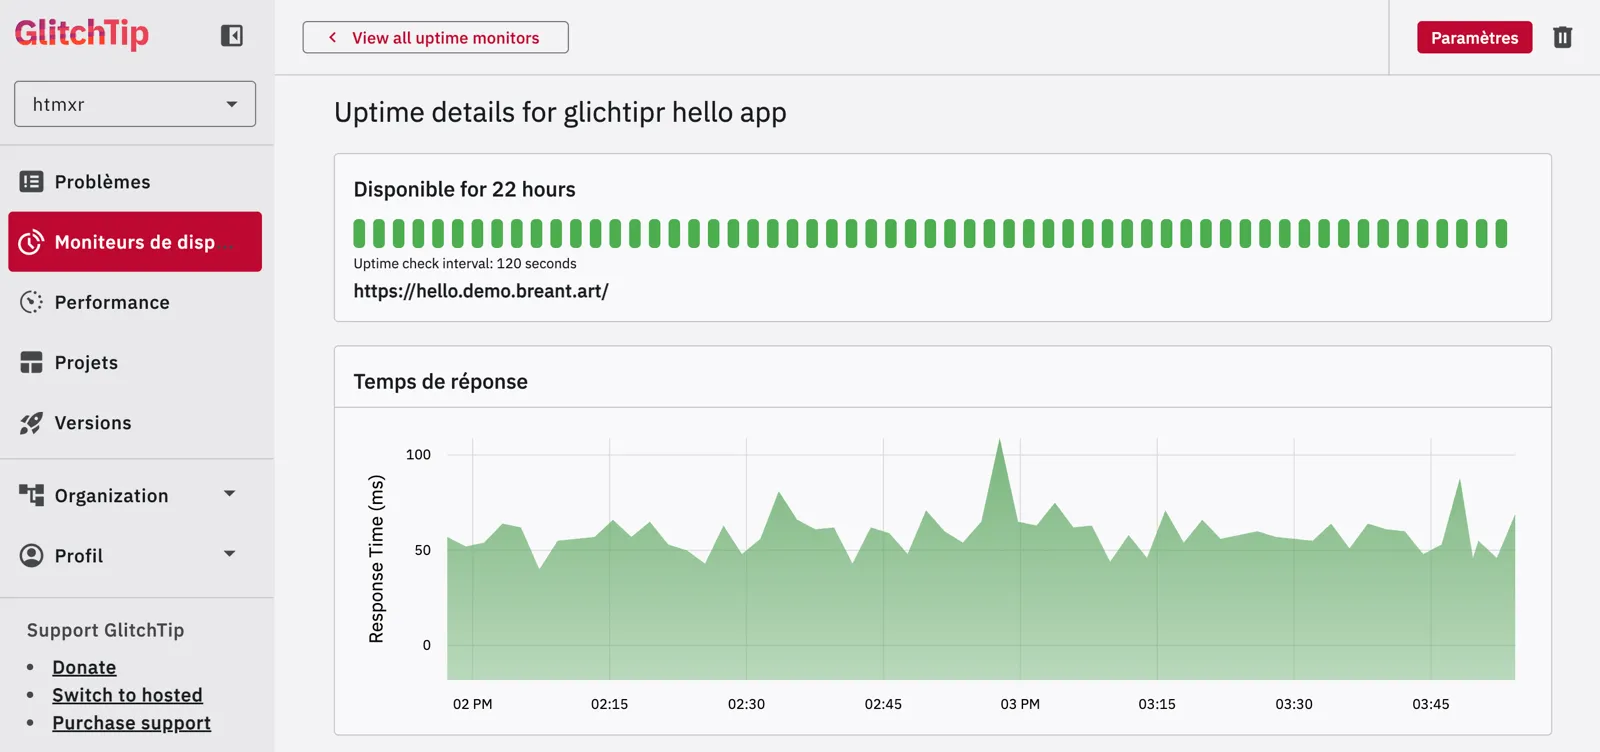
What to track, and what not to
Not every error deserves to be in your dashboard. The rule of thumb: track errors that reveal a bug in your code, not expected user behaviour.
Track these:
- Unexpected errors in route handlers: anything that shouldn’t happen
- Failed connections to a database or external API
- Errors in code paths you assumed were safe
Skip these:
- 404s: the user navigated to a URL that doesn’t exist. Not your bug.
- 401 / 403: unauthenticated or forbidden requests are expected behaviour.
- Validation errors: the user submitted a bad form value. Handle them gracefully in your UI, don’t report them as bugs.
In practice with @capture: if a route can legitimately receive bad input,
validate it explicitly and return a clean error response. Reserve @capture
for the logic that runs after validation, where a failure means something
went wrong in your code.
Works with Shiny too
gt_capture() is framework-agnostic, so use it in any R code, including Shiny
reactive contexts.
# In render functions: Shiny catches the re-raised error and displays it
output$plot <- renderPlot({
  gt_capture(gt, {
    hist(faithful[, 2], breaks = input$bins)
  })
})

# In observers: wrap with tryCatch after gt_capture() to protect the session
observeEvent(input$submit, {
  tryCatch(
    gt_capture(gt, { process(input) }),
    error = function(e) invisible(NULL)
  )
})
Setup
You’ll need a GlitchTip instance, either self-hosted or the hosted version. Create a project, copy the DSN, and you’re ready.
Add your DSN to .Renviron (usethis::edit_r_environ()):
GLITCHTIP_DSN=https://KEY@glitchtip.example.com/PROJECT_IDIf no DSN is set, gt_connect() returns an inactive connection and
gt_capture() is a zero-overhead no-op.
pak::pak("hyperverse-r/glitchtipr")